Work Zone Fatalities, Injuries, & Crashes
Between 2013 and 2023, work zone fatalities increased 50 percent. In 2023, over 898 work zone fatalities were recorded. [9] Stated another way, 898 work zone fatalities is the equivalent of 5 commercial domestic airliners. In 2023, over 101,000 work zone crashes were estimated to have occured resulting in over 40,000 injuries. [8] Stated another way, 40,000 injuries is about the capacity of a football stadium. Every injury or death alongside roadways and highways is one too many.
"[H]ighway construction workers are often the unsung heroes of the nation’s transportation system... The men and women fixing our streets, highways and bridges are among the most vulnerable road users" according to the FHWA. [57] [58] Highway workers have also doubled as first responders and have been credited with saving motorist and pedestrian lives. [59] [60] [61] [62] [63] [64] [65]
"The U.S. economy is dependent on surface transportation – $1 of every $10 of the gross domestic product is tied to moving goods and people."
Work zone intrusions are a serious hazard to highway workers. [54] [55] When struck by a median U.S. pickup, a 2024 IIHS study found that a pedestrian worker has an 85% likelihood of severe injury at just 33 mph and an 85% likelihood of dying at just 45 mph. [50] A single work zone intrusion can have irreversible outcomes (e.g. multiple deaths, severe long-term injuries, etc.).
"Cones and barrels are not positive protection... Shifting away from cones and barrels to the widespread use of positive protection may be the single most important step we can take to protect [lives]... in highway work zones."
Damages and losses from work zone crashes are estimated to reach over $38.9 billion annually (2025 dollars, comprehensive crash costs). [28] [29] [43] Cost savings from reducing the number crashes by implementing Positive Protection devices & barrier separation in work zones can be estimated at over $3.8-$8.9 billion annually (10%-23% of work zone crash costs, 2025 dollars). [42] Stated another way, $3.8 to $8.9 billion in annual cost savings is equivalent to the cost of 7 to 17 transportation "Major Projects". [47] Stated another way, $3.8 to $8.9 billion in annual cost savings is equivalent to the cost of repairing 2,400-5,670 miles of highway in poor condition, which includes potholes (i.e. 1 or more states worth). [56]
In a 2025 Associated General Contractors of America (AGC) survey, most highway contractors (60%) reported crashes into their work zones. [51] In 2025, 43% of highway contractors surveyed by AGC reported that work zone crashes resulted in worker injuries or fatalities. [51] "In 2015, 35 percent of all highway worker fatalities at road construction sites resulted from a vehicle striking a worker. By 2021, this alarming figure had increased to 63 percent" reports Laborers' Health & Safety Fund of North America (LHSFNA). [44]
In a prior AGC survey, 89% of highway contractors said Positive Protection would help improve safety and prevent these horrific crashes. [4] California research found a cost benefit for highly mobile barrier of $1.9 million in 2008 dollars ($2.87 million in 2025 dollars) per year, per barrier. [14]
"Creating a protective barrier between motorists and workers is an essential step."
Often, work zone intrusions cause preventable deaths and injuries (e.g. could be eliminated as they do not result from natural causes). Tunnel, culvert, bridge repair projects and their work zones have been identified as having serious hazards. Federal law (23 CFR 630.1108(a)) and ANSI Standard A10.47-2021 (§4.4) identify types of projects that require Positive Protection barriers. For such projects, a “separate pay item” for positive protection is required under federal law and regulations. [1] [11]
"When serious hazards are foreseen or encountered on a project, positive protection should be specified and an associated pay item provided..."
Project owners have funding support for Positive Protection (i.e. Positive Protection can be covered up to 100% by HSIP and other federal funds). Contractors have options for obtaining and using Positive Protection on projects. Project compliance with federal regulations and industry ANSI standards specifying use of Positive Protection barriers is vital. In California, Caltrans award-winning Positive Protection Program directs Caltrans design engineers and Contractors to use Positive Protection to ensure worker safety. Speaking up about work zone safety issues could reduce risk & save a life.
"Motorists will inevitably make mistakes. Too often they pay for their mistakes with their lives – or the lives of innocent bystanders.... We have the technology and 'know how' to build our roadway system to anticipate user error. It can be designed, constructed, equipped, and operated to forgive the errant user and protect the innocent victim."
"Blaming human error alone is convenient, but it places all Americans in greater danger."
Work Zone Intrusions are a Serious Hazard to be Managed
"...safety, health, and well-being are inherent rights of every worker."
In a 2024 survey of one state DOT's highway workers, "[t]he most cited [safety] concern by most respondents was getting struck by vehicular traffic." [53] In 2025, alarmingly, a number of road rage incidents towards pedestrian highway workers have been reported. [52]
Road maintenance workers were killed on the job 3.7 times more often than the average American worker & 19 times more often than engineering & office/administrative workers. [39][40]
A prior study found that 38% of "Pedestrian" fatalities in work zones were highway workers (i.e. road construction/maintenance workers, utility workers, and planning/surveying workers). In 2020, during the COVID-19 pandemic, work zone crashes & fatalities climbed despite lower traffic volumes. [20] [21] [22] [23] [32] [33] In early 2024, the Governor's Highway Safety Association (GHSA) found that the U.S. pedestrian fatality rate has jumped 48% from a decade ago. [34]
"Injuries [from stuck by incidents] range from contusions and lacerations to fractures, crushing, and fatalities."
"Most injuries [to pedestrians] arising from these vehicle and ground impacts in adults are trauma to the head, legs and pelvis., tibial plateau fractures and ligamentous injuries of the knee, as well as traumatic brain injuries, are all common."
"[T]he most common cause of death of pedestrians is head injuries...Among all concurrent injuries, lower extremity/pelvic injuries were observed in 216 patients (23.56%)... Over one-third of pedestrians had 4 simultaneous injuries, with an average cost of $243,992 [2023 dollars], which was 1.6 times more than the cost of a pedestrian with only one injured part"
"[P]ositive protection measures ensures that no worker should pay the ultimate price for a job. We have witnessed far too many workplace accidents that could have been prevented with these common-sense safety measures in place..."
Often, work zone intrusions cause preventable deaths and injuries (e.g. could be eliminated as they do not result from natural causes). Tunnel, culvert, bridge repair projects and their work zones are have been identified as having serious hazards in regulations and ANSI Standards, with high-speed traffic moving in close proximity to employees, roadside hazards, and/or little or no means for pedestrian employees to escape from errant moving vehicles. Serious hazards are hazards that are causing or are likely to cause death or serious physical harm.
In addition, activities perceived by DOT highway workers in a 2024 survey as most hazardous were (1) Roadway/Shoulder Maintenance, (2) Guardrail/Cable Rail Maintenance, (3) Mowing and Trimming, and (4) Patching. [53]
👉 Tunnel work zones have serious hazards.
Tunnel Case Study #1: On June 18, 2025 a northbound vehicle intruded into a tunnel work zone unimpeded and struck a scissor lift extended to the ceiling (supporting 2 employees). One 27 year-old employee was thrown to the ground and received life threatening injuries.
“[W]e could hear the van hitting barrels coming toward us. We didn’t have but a second to react.” The vehicle slammed into a scissor lift, sending one worker falling to the pavement and the other clinging for his life about 25 feet up for more than 20 minutes. "I was able pull myself into the lighting system we were installing as the [scissor] lift was swept out from under me." The driver and one worker were airlifted in critical condition.

👉 Trench work zones have serious hazards.

Trench Case Study #1: In 2011, a 20 year-old worker was in a trench on a wiring project on Highway 101, when a car drifted onto the road shoulder and struck him in the trench. The young man was left paralyzed and unable to speak from injuries he suffered.
Trench Case Study #2: On December 20, 2024 a 33 year-old motorist crashed into 40-foot-deep trench along Highway 290 after missing a turn toward the frontage road. The driver was airlifted to the hospital. A similar crash previously happened in September.
👉 Bridge work zones have serious hazards.
Bridge Case Study #1: On June 13, 2025 one worker jumped 40 feet off the bridge to avoid being struck by the errant vehicle after two other workers were struck as the vehicle crashed through a bridge work zone. All three state DOT employees were rushed to the hospital.
Bridge Case Study #2: On January 13, 2026, two MaineDOT workers were killed after being thrown off a bridge as a result of a secondary collision which catapaulted a minivan into three of six workers inside the bridge work zone. "The impact propelled two of the workers over the bridge and onto Kennedy Memorial Drive below." State Police said in a statement.
High-speed traffic moving in close proximity to employees is known to be a serious hazard. 2023 NHTSA FARS data indicates that the posted speed limit was 45 mph or less for 40% of pedestrian fatalities inside work zones. [9]
👉 High Operating Speeds are a serious hazard.
High Operating Speed Case Study: In an April 2021 CPWR webinar, a highway contractor reflected on a work zone intrusion: In a posted 45 MPH work zone, a drowsey driver fell asleep and drifted into a lane closure at 70 MPH striking multiple cones. The vehicle continued unimpeded for 3 seconds, when it struck a 41-year old pedestrian employee (who was a husband, father and son) and threw him more than 50 feet. He died at the scene. In June 2021, the contractor joined in efforts calling on industry and roadway owners "to update state standard specifications to give stronger consideration to the use of barriers between workers and motorists."
A December 2024 IIHS study found that during an impact with a modern taller SUVs and pickup, pedestrians (i.e. workers on foot) are at very high risk. When struck by a median U.S. pickup, a highway worker has an 85% likelihood of severe injury at just 33 mph and an 85% likelihood of dying at just 45 mph. [50] The thresold for a "safe" crash speed (risk of serious injury is 10% or less as commonly quoted in literature) occurred at about 15 mph for pedestrians (i.e. workers on foot).[50]
“As crash speed increases from 15 mph to 35 mph, the risk of a serious injury [for a pedestrian] goes from 9% to 52% when a median-height car is involved. With a median pickup, the risk [of a serious injury for a pedestrian] shoots up from 11% to 91% [as crash speed increases from 15 mph to 35 mph]... The findings point to the need for policymakers and traffic engineers to account for the makeup of the U.S. fleet. A commonly used benchmark for a 'safe' crash speed is one at which the risk of serious injury is 10% or less.”
“When the drivers get past the police, they speed back up as they’re entering the work zone.”
“People will move over after they see the first truck, then get back into their lane instead of staying over until they’re out of the work zone.”
👉 Close proximity is a serious hazard.
Close Proximity Case Study #1:
Near Miss: Footage of a June 2025 intrusion into a DOT work zone in close proximity to live traffic. The semi-truck clipped the crane arm which caused the bucket to collapse. After the bucket collapsed, the employee was left hanging upside down above the roadway.
Close Proximity Case Study #2:
Near Miss: Footage of a November 2024 intrusion into a DOT work zone in close proximity to live traffic.
A single work zone intrusion can have high consequence outcomes (e.g. multiple employee deaths, severe long-term employee injuries, project delays, damaged/totaled equipment, rework, and/or liability).
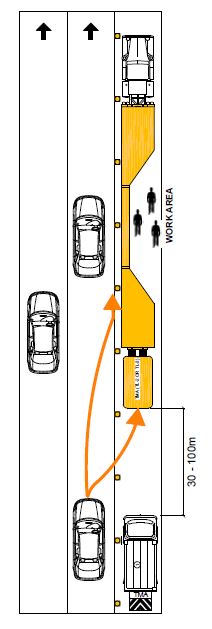
Fortunately, Positive Protection barriers can be used to directly control these hazards to highway workers, who are among the most "Vulnerable Road Users". Positive Protection are devices placed "between workers and motorized traffic" which function to "contain and/or redirect vehicles" and which meet applicable crashworthiness criteria (see 23 U.S.C. § 112(g) and 23 C.F.R. § 630.1104).
The USDOT Safe System Approach and FHWA Safe System Roadway Design Hierarchy (based on the "Hierarchy of Controls" workplace safety protocol) emphasize that death/serious injury is unacceptable and that safety is proactive (e.g. engineering in and using Positive Protection barriers proactively to seperate workers from traffic).
"Focus on the hierarchy of controls (risk treatments) to design a workplace where pedestrian employees do not encounter moving vehicles, materials and similar hazards."
Federal law (23 CFR 630.1108(a)) and ANSI standards (A10.47-2021 §4.4) specify types of projects (e.g. tunnels, bridges, drop-offs, etc.) which require require Positive Protection devices & barrier separation in work zones. For such projects, a “separate pay item” for positive protection is required under federal law and regulations. [1] [11] Project Owners have options for funding Positive Protection. Contractors have options for obtaining and using Positive Protection.
"When serious hazards are foreseen or encountered on a project, positive protection should be specified and an associated pay item provided..."
MASH certified traffic barriers placed between workers and motorized traffic (i.e. Positive Protection) offer state-of-the-art safety for workers and motorists by physically preventing (i.e. containing and/or redirecting) high-speed motorized vehicles from colliding with workers and other dangerous obstacles inside a work zone. In a national survey, 89% of highway contractors think Positive Protection would help improve safety and prevent these horrific crashes. [4] Speaking up about work zone safety issues could reduce risk & save a life.
"It is difficult to change the behavior of motorists...But we can and must institute protective measures like positive barriers and other available controls."
In 2015, Congress directed FHWA to "do all within its power to protect workers in highway work zones." [45] Federal law and ANSI Standard A10.47-2021 (§4.4) identify types of projects that require Positive Protection barriers. For such projects, a “separate pay item” for positive protection is required under federal law and regulations. [1] [11] The Infrastructure Investment and Jobs Act of 2021 (IIJA) amends the Highway Safety Improvement Program (HSIP) to increase funding & protection for "Vulnerable Road Users", which includes "highway workers on foot". [41] In 2024, USDOT set the value of a single life (VSL) at $13.7 million dollars. [13] [37]
In 2021, California launched its award-winning Caltrans Positive Protection Program which directs Caltrans design engineers and Contractors to use Positive Protection to ensure worker safety. California research found a cost benefit for highly mobile barrier of $1.9 million in 2008 dollars ($2.87 million in 2025 dollars) per year, per barrier. [14]
Today, we have the technology, 'know how', and responsibility to protect highway workers from errant vehicles by implementing Positive Protection barriers.
"If a work zone has 'no means of escape' from motorized traffic, then no operating speed is truly safe. An unprotected worker who cannot escape faces serious injury from motor vehicles at any speed, even walking speeds... One study cited by FHWA show[ed] that the risk of a pedestrian crash fatality reaches 45% at 30 mph and 85% at 40 mph, and another study estimat[ed] that pedestrians have less than a 50% chance of surviving a crash with a vehicle traveling 30 mph or above... The risks posed to road workers will likely further increase as the size of vehicles in the U.S. continues to grow larger. According to a recent Insurance Institute for Highway Safety (“IIHS”) study, the average U.S. passenger vehicle has grown 4 inches wider, 10 inches longer, 8 inches taller, and 1,000 pounds heavier over the past 30 years. Significantly, the IIHS study found that vehicles with higher front ends (pickup trucks, SUVs and vans with a hood height greater than 40 inches) were 44% to 45% more likely to cause fatalities in crashes with pedestrians than smaller cars and trucks."
“A physical barrier provides one of the best possible protection solutions for workers exposed to the flow of traffic. [Implementing Positive Protection] is a common-sense and cost-effective way for safety reform that will prevent death and injuries of workers on roads and highways.”

"We have the technology and 'know how' to build our roadway system to anticipate user error. It can be designed, constructed, equipped, and operated to forgive the errant user and protect the innocent victim."
2025 Contractor Reported Work Zone Crashes, Project Delays, Injuries, & Fatalities
In 2025, 60% of Highway Contractors Reported Crashes into their Construction Work Zones
The Associated General Contractors of America's (AGC) 2025 nationwide study on highway work zone safety reveals that 60% of highway contractors reported work zone crashes over the last year. As a result of these work zone crashes, 60% of firms reported project delays, 13% reported worker fatalities, 30% reported worker injuries, 24% reported public fatalities, and 61% reported public injuries. 98% of highway contractors also reported that the risk of highway work zone crashes is as great or greater than a year ago. [51]
AGC Study - Outcomes of Work Zone Crashes
[51]
(Mouseover data points for details.)
The 2019 AGC study revealed that an increasing percentage of contractors believe Positive Protection would improve safety on their projects.
- 89% of contractors report that increased use of Positive Protection barriers would help reduce injuries and fatalities on their projects. [4]
Estimated National Work Zone Crashes & Injuries [8]
The number of crashes in work zones and injuries resulting from those crashes has been increasing.
- In 2021, an estimated 101,000 crashes and 40,000 injuries were estimated to have occurred in work zones.
Estimated Work Zone Crashes and Resulting Injuries*
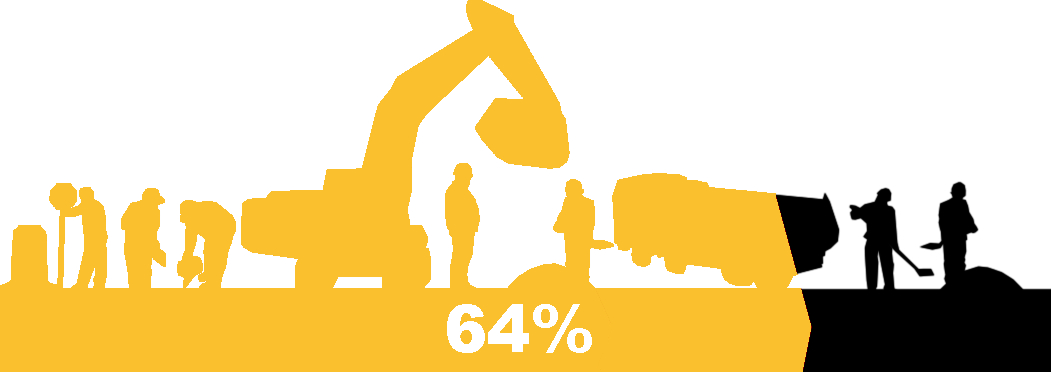
* Estimated Work Zone Crashes & Injuries Data are obtained from NHTSA statistical models (NASS/GES & CRSS). The NHTSA statistical models underestimate work zone crash fatalities by as much as 64% in 2019 (see Table 1 below). In general, the NHTSA FARS & CRSS crash report datasets underreport work zone crashes as well as resulting injuries and fatalities (see note †).
Table 1. NHTSA CRSS Statistical Model Percent Error:| 2015 | 2016 | 2017 | 2018 | 2019 | 2020 | 2021 | 2022 | 2023 | |
|---|---|---|---|---|---|---|---|---|---|
| Recorded Fatalities (FARS) |
701 | 781 | 806 | 754 | 842 | 857 | 954 | 891 | 898 |
| Estimated Fatalities (CRSS Statistical Model) |
349 | 525 | 597 | 636 | 298 | 478 | 714 | 1111 | 717 |
| Percent Error (of CRSS Statistical Model) |
-50% | -32% | -26% | -15% | -64% | -44% | -33% | 24% | -20% |
National Work Zone Crash Fatalities [9]
Work zone crash fatalities have been on the rise nationally.
- 50% increase in fatalities since 2013.
Fatalities Resulting from Work Zone Crashes†
†
In general, the NHTSA FARS & GES/CRSS crash report datasets underreport work zone crashes as well as resulting injuries and fatalities.
The statistic for fatalities resulting from work zone crashes is obtained from NHTSA FARS dataset which attempts to aggregate various state police crash report datasets.
However, crashes occurring inside work zones are not always properly classified by police as work zone related.
Work zone crashes are under representative in crash statistics... Safety analysts often resort to a manual review of the crash narrative in order to recover the missed work zone crashes.
A cursory glance of NHTSA FARS data in 2018 quickly reveals examples of missed fatalities resulting from work zone crashes. A number of studies confirm that work zone crashes are under represented in NHTSA crash datasets. [30] [31]
Pedestrian Fatalities in Work Zones
Pedestrian fatalities inside work zones encompass both workers and members of the public. A review of NHTSA FARS data confirmed that 38% of pedestrian fatalities inside work zones occurred while working in 2018. In 2023, 176 pedestrians were struck and killed inside a work zone. [9] "In 2015, 35 percent of all highway worker fatalities at road construction sites resulted from a vehicle striking a worker. By 2021, this alarming figure had increased to 63 percent" notes Laborers' Health & Safety Fund of North America (LHSFNA). [44]
"So what can help protect against intrusions?... It is difficult to change the behavior of motorists...But we can and must institute protective measures like positive barriers and other available controls."
A single work zone intrusion can have high consequence outcomes (e.g. multiple employee deaths, severe long-term employee injuries, project delays, damaged/totaled equipment, rework, and/or liability). Tunnel, culvert, bridge repair work zones, etc. are known to be extremely hazardous with high-speed traffic moving in close proximity to employees, roadside hazards, and/or little or no means for employees to escape from errant moving vehicles. Traffic speed is another well-known hazard to highway workers. 2023 NHTSA FARS data indicates that the speed limit was 45 mph or less for 40% of pedestrian fatalities inside work zones. [9] A December 2024 IIHS study found that during an impact with a modern taller SUVs and pickup, pedestrians are at very high risk. When struck by a median U.S. pickup, a highway worker has an 85% likelihood of severe injury at just 33 mph and an 85% likelihood of dying at just 45 mph. [50]
“As crash speed increases from 15 mph to 35 mph, the risk of a serious injury [for a pedestrian] goes from 9% to 52% when a median-height car is involved. With a median pickup, the risk [of a serious injury for a pedestrian] shoots up from 11% to 91% [as crash speed increases from 15 mph to 35 mph]... The findings point to the need for policymakers and traffic engineers to account for the makeup of the U.S. fleet. A commonly used benchmark for a 'safe' crash speed is one at which the risk of serious injury is 10% or less.”
"Pedestrian involvement in fatal work zone crashes overall does not appear to be overrepresented on facilities in urban areas but is on minor arterials and collectors/local roads in rural areas. Given the low pedestrian involvement in non-work zone crashes on these facilities in general, it is likely that the overrepresentation reflects collisions with highway workers on foot on these facilities. Based on U.S. Bureau of Labor Statistics (BLS) data, 45 percent of all worker fatalities at road construction sites involve a vehicle striking a worker on foot [2019]."
Work zone pedestrian fatalities are often assumed to be members of the public who have fallen into complacency walking a routine route. However, in 2018, a review of NHTSA FARS data confirmed that 38% of pedestrian fatalities in work zones were actually on the job and primarily engaged in road work, utility work, and planning/surveying.
Work activities at the time of death include activities such as installing traffic signs, reopening a lane, flagging, picking up debris, replacing damaged concrete, paving operations, exiting a work vehicle, utility work, construction labor, DOT electrical work, DOT maintenance work, fence contracting, repairing guardrail, stringing cable guard rail, and repairing a bridge.
Based on a review of each work zone pedestrian fatality, it is found that
- Activity: Many Pedestrian Fatalities in Work Zones occurred while working (38%, 46 of 122).
- Work Activity: The majority of Working Pedestrian Fatalities in Work Zones were engaged in road work, utility work, planning/surveying (87%, 40 of 46 Working Pedestrians).
- Work Hazard: The majority of Working Pedestrian Fatalities in Work Zones were killed by motorist incursions (80%, 37 of 46 Working Pedestrians)
- Location: Few Pedestrian Fatalities in Work Zones occurred at/near intersections (15%, 18 of 122).
38% of Pedestrian Work Zone Fatalities occured while working.
Primary Activity of the 122 Pedestrian Work Zone Fatalities (2018)
87% of Working Pedestrians were engaged in Road Work, Utility Work, or Planning/Surveying.
Work Activity of the 46 Working Pedestrians in Work Zones (2018)
Road Work activities at the time of death include activities such as installing traffic signs, reopening a lane, flagging, picking up debris, replacing damaged concrete, paving operations, exiting a work vehicle, utility work, construction labor, DOT electrical work, DOT maintenance work, fence contracting, repairing guardrail, stringing cable guard rail, and repairing a bridge.
Methodology
Fatality data was obtained from the 2018 NHTSA FARS dataset [9] . Accident and Person datafiles were joined on ‘ST_CASE’ and filtered by ‘WRK_ZONE’>=1 (ACCIDENT file records a work zone), ‘INJ_SEV’==4 (PERSON file records a fatality for that person), and ‘PER_TYP’==5 (Person type recorded as Pedestrian). Each fatality was then categorized by Activity, Location, Work Type, and Work Hazard based on FARS, News Article, & OSHA case record information.